Using Pandas to dig into cloudfront logs
by Jeff
Let’s have some more jupyter fun and dig into doing cloudfront log analysis with jupyter, pandas and dash using this notebook!
Stealing tools from Data Science
Data science has long been a fan of jupyter notebooks and libraries like pandas, numpy, etc for analysis. Let’s take a look at using those same tools for infosec investigations. If you need a refresher on getting jupyter up and running, check out my previous post.
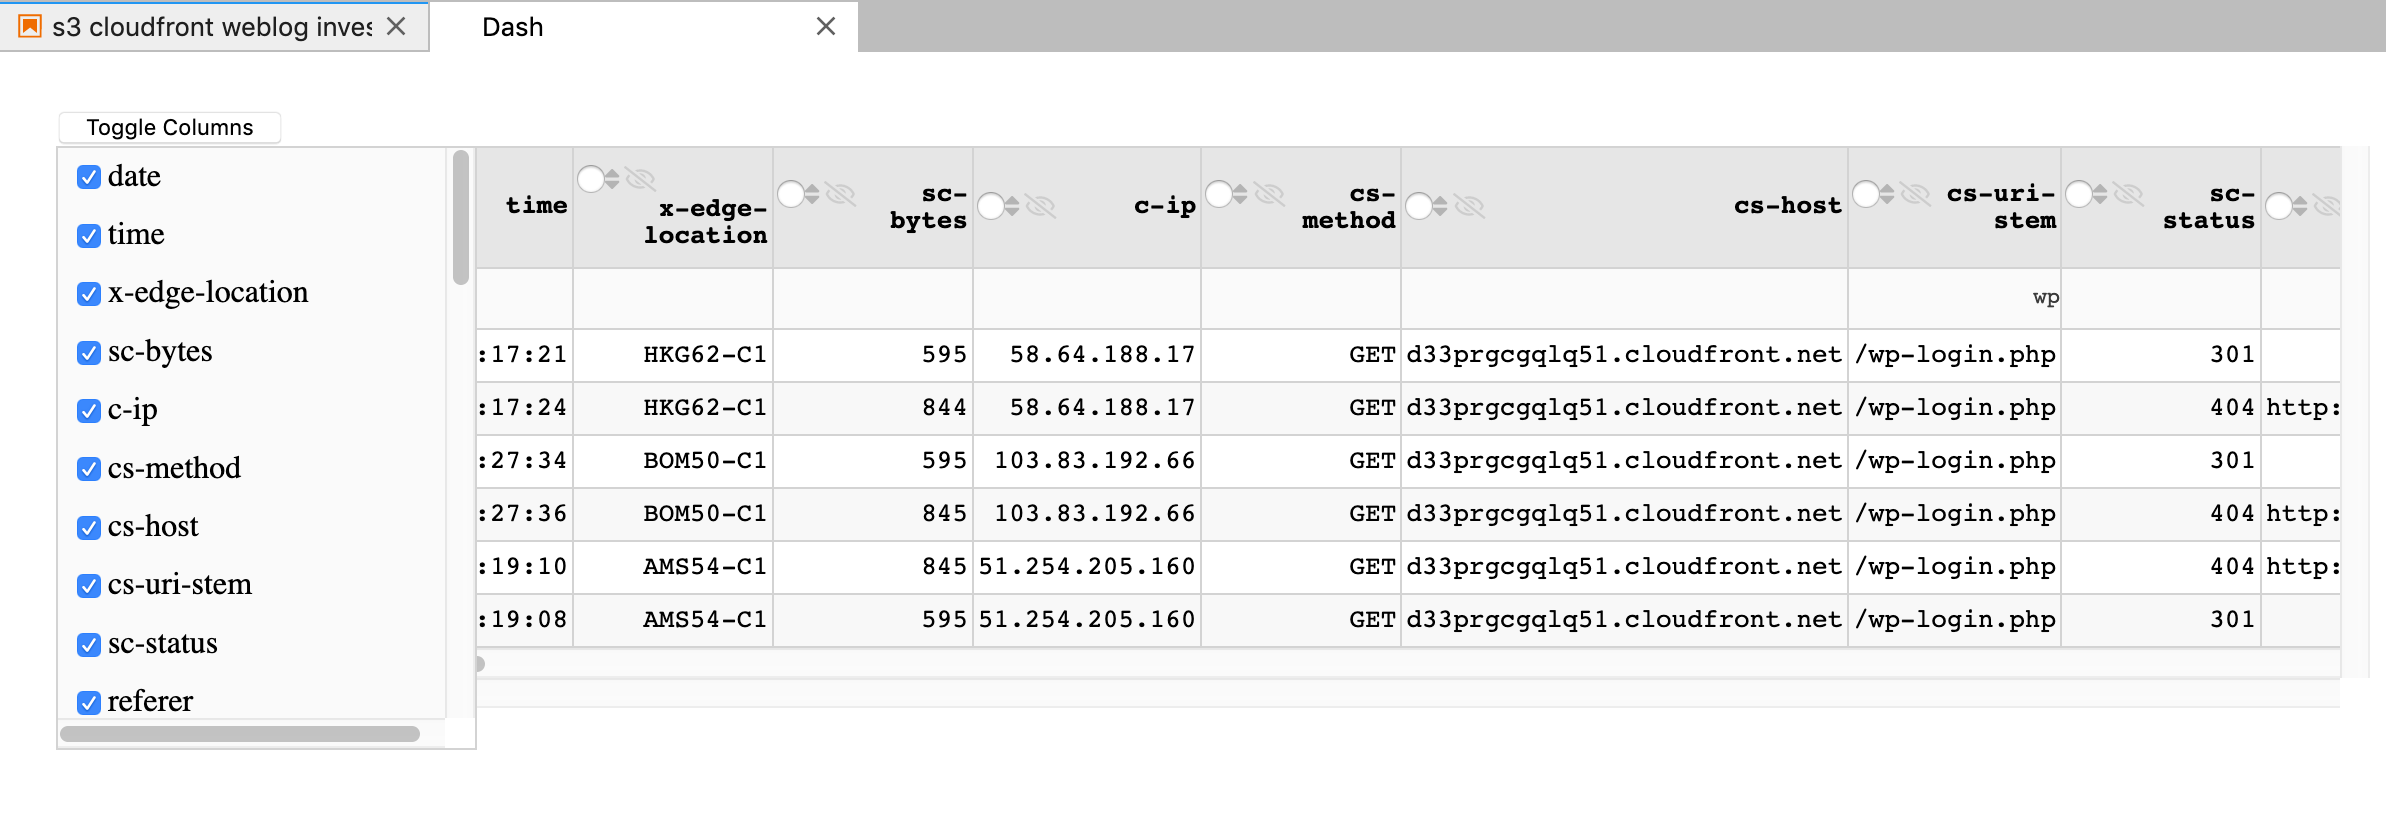
a dash table in action
In this post I’ll walk you through how to :
- Connect to AWS
- Read in selected cloudfront logs
- Clean up the data
- Use pandas for analysis
- Setup jupyter lab to be able to use the dash datatable
- Browse the dataset using dash’s datatable
Connecting to AWS
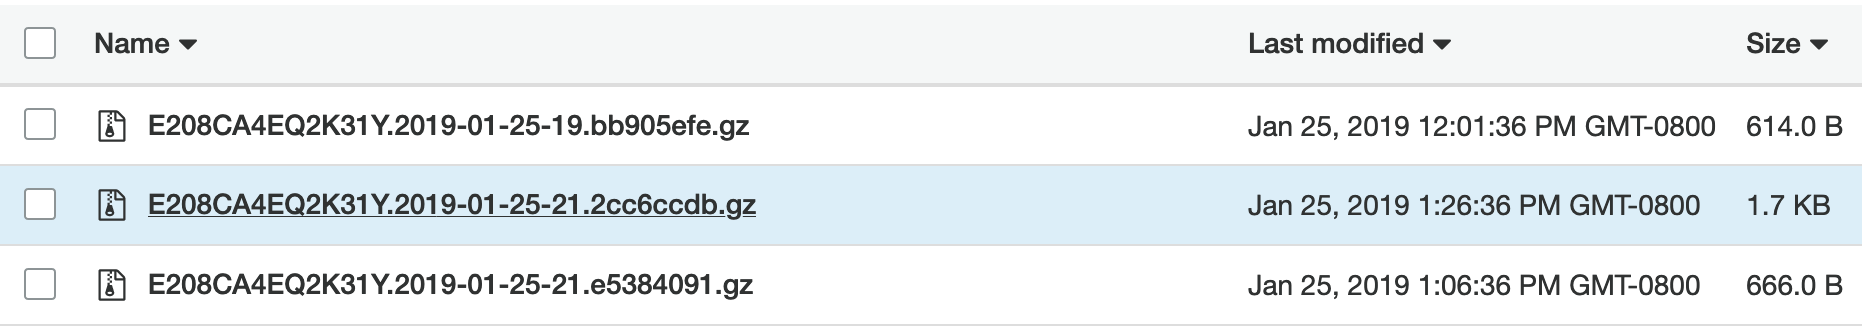
In this scenario we are reading in cloudfront logs from a distribution deposited in an S3 bucket. To my knowledge, cloudfront doesn’t organize it’s logs into folders within the bucket, it just deposits gzipped files names with the date:
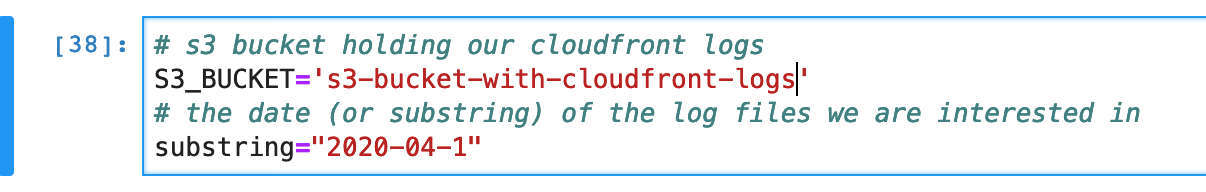
So our first task is to connect to aws, find the logs we are interested in, unzip them and import them into pandas. The first cells are setting up the target S3 bucket and the date we are interested in.
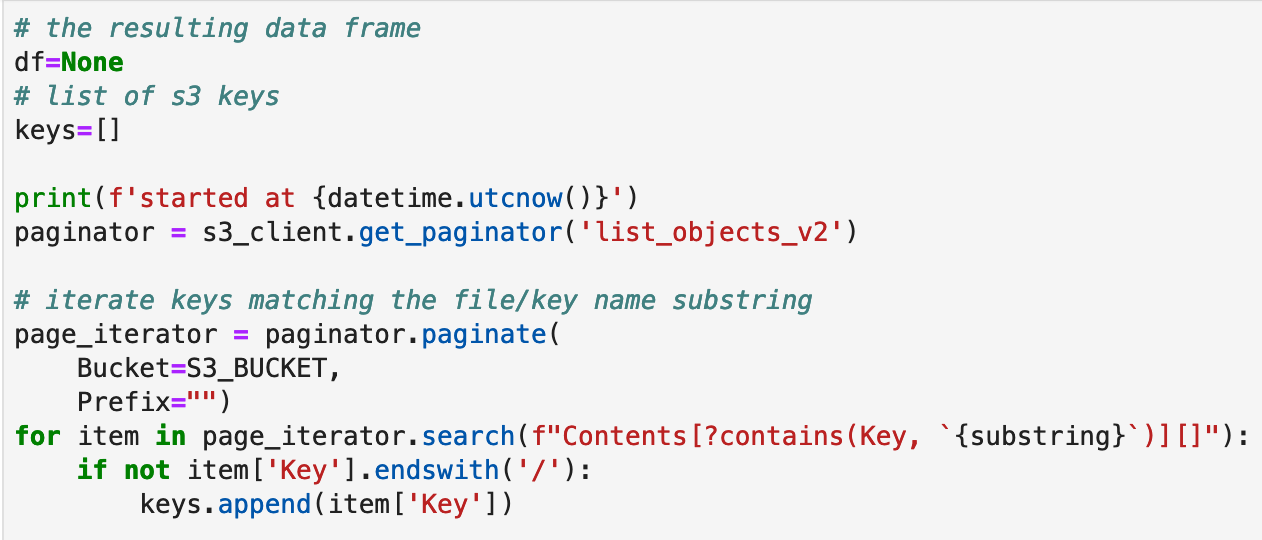
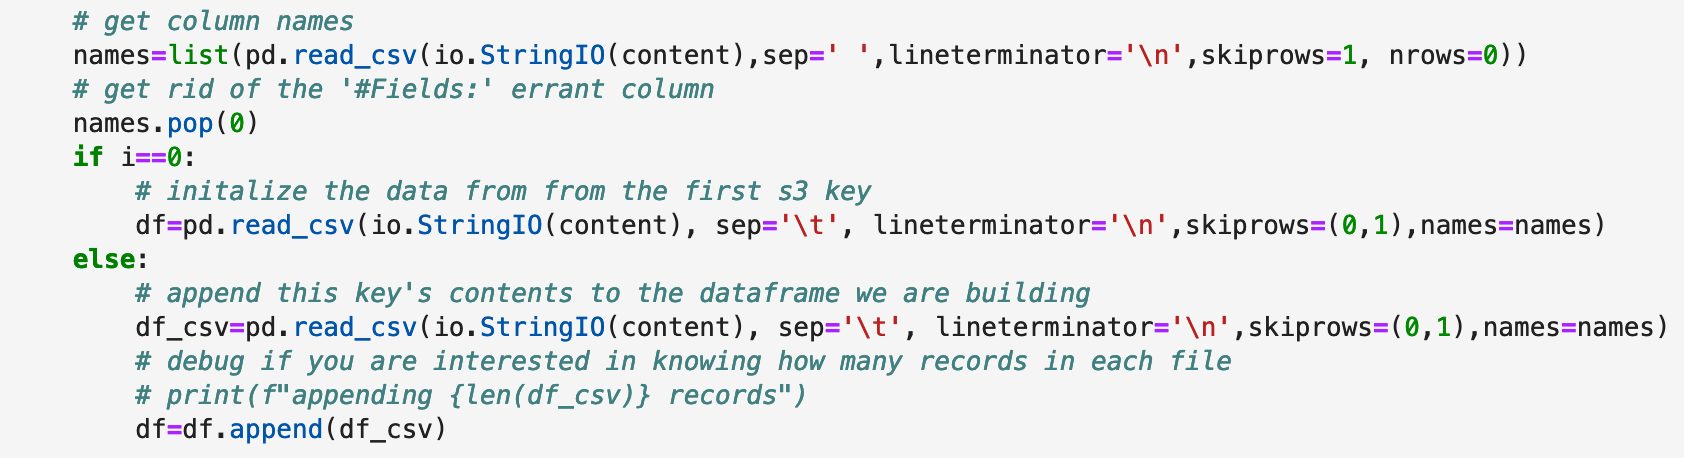
Gather cloudfront logs
After that we paginate the s3 bucket list of keys matching our substring and pull in the contents into a pandas dataframe using it’s built in csv importer. Most of the code here is just dealing with finding buckets and then handling a mix of gzipped and non-gzipped files.
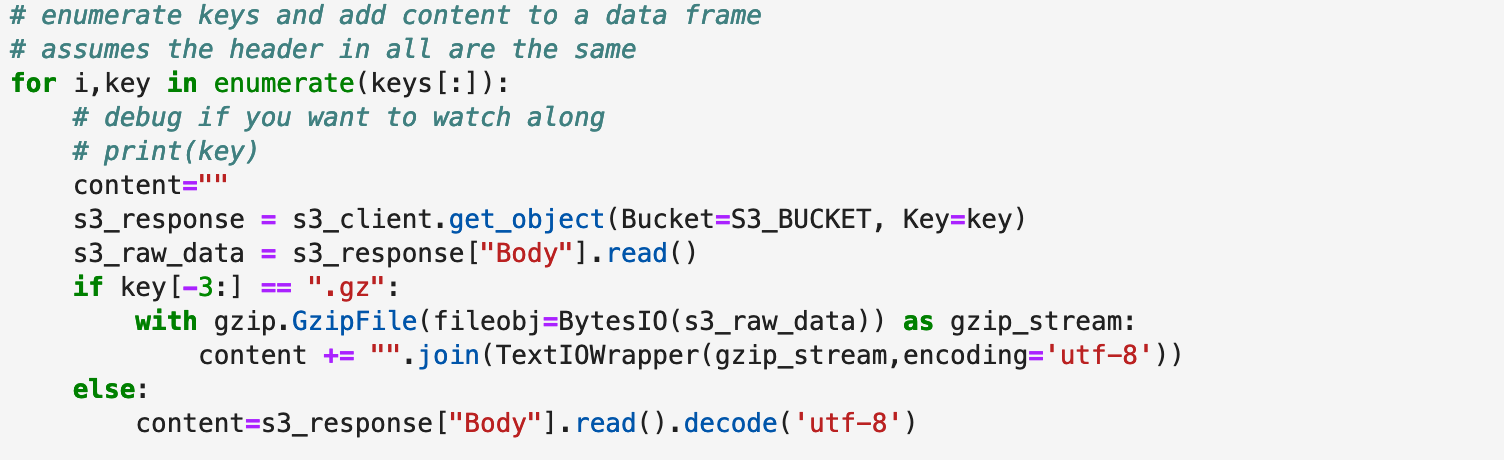
Pandas is doing all the work to load the log data for us. Their csv module is quite the engineering feat! You can tweak it almost endlessly to get it to properly read in data.
Pandas/Clean up
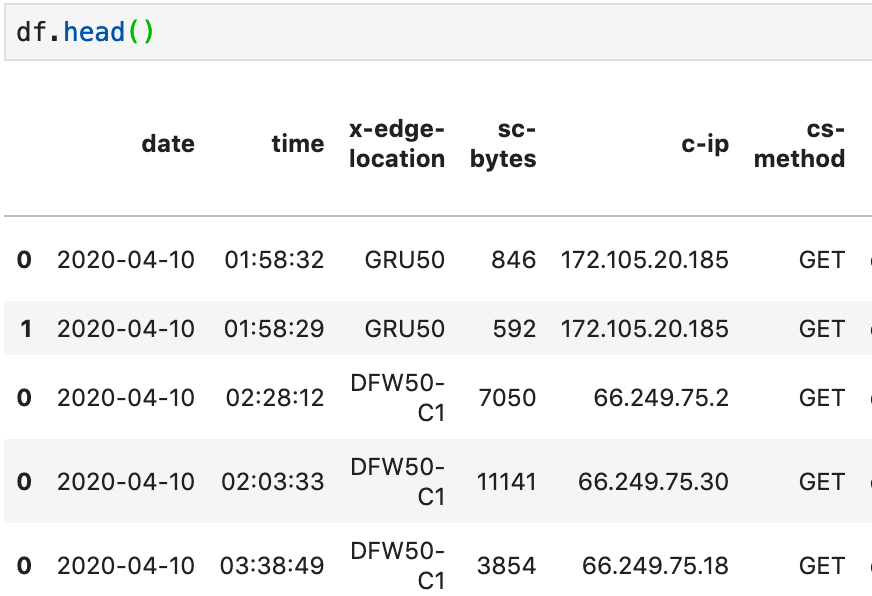
If you’ve never used pandas, it’s a dataframe oriented library that makes it easy to slice and dice data in large quantities. It is customary to name your dataframe variables ‘df’ so when you see tutorials referencing ‘df’ they are using a dataframe object. You can get a peak at what it has loaded with the df.head() function:
This will give you a quick overview, but not all the columns that have been loaded. For that, we do some inspection and clean up of the column names. df.columns.to_list() is the easiest way I’ve found to get a look at what pandas has read in as columns. You can rename the columns to your liking if you need to. Spaces and special characters can get annoying so here are two ways to rename columns
There’s a rename function:
# Fix up column names to be more friendly
df.rename(columns={'cs(Referer)': 'referer'}, inplace=True)
Or you can act on all columns at once:
#replace any other ones with () to dashes
df.columns = df.columns.str.replace('(','-')
df.columns = df.columns.str.replace(')','')
df.columns = df.columns.str.lower()
Pandas analysis
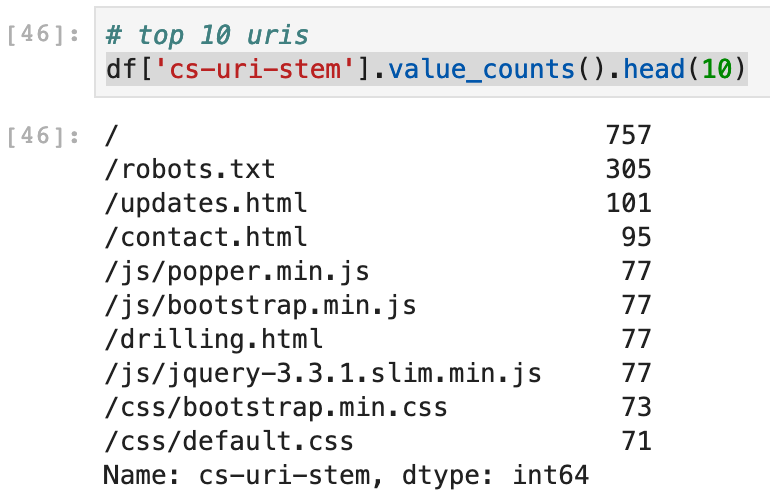
Now comes the fun part. Pandas can do a bunch of work we infosec folks would usually do in spreadsheets, aggregation functions, etc. Here’s the top and bottom 10 URIs:
df['cs-uri-stem'].value_counts().head(10)
And of course infosec usually starts at the bottom:
df['cs-uri-stem'].value_counts().tail(10)
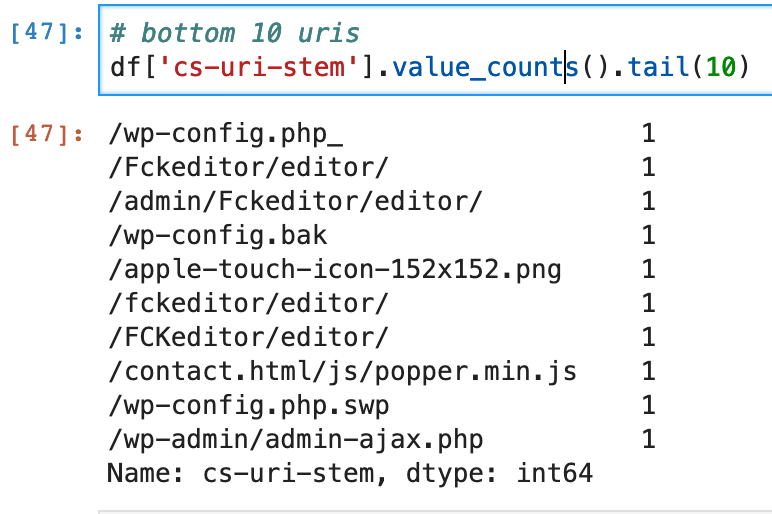
We can see some folks probing for wordpress/php.
The .str function is especially useful for allowing us to do basic string matching. Combine that with pandas’ functions for selecting rows and you can start to get basic counts:
# How many hits from bots?
len(df[ df['cs-user-agent'].str.contains('bot') ])
The df[ df[‘fieldname’] ] is a selector, similar to SQL. We can use it to query the dataset for simple counts like our count of bot hits, or to pull out sections of the dataframe.
len(df[df['sc-status'].isin([200])]) gives us a count of hits with a 200/ok status. Remove the ‘len’ function and you could get a list of all the hits, complete with columns.
A neat trick I learned from a pancakescon talk is to setup some boolean values using column values to make selection easier
Lets create a ‘bot’ column that’s True if the user-agent column contains ‘bot’ in the string:
df['bot']=df['cs-user-agent'].str.contains('bot')
We can then use this to select or eliminate hits from bots in our data analysis. We can do the same for non-error hits:
df['ok']=df['sc-status'].isin([200])
and put all this together to get a simple list of referrers:
df[ (df['cs-uri-stem']=='/' ) & (df['ok']) & (df['bot']==False) ]['referer'].value_counts()
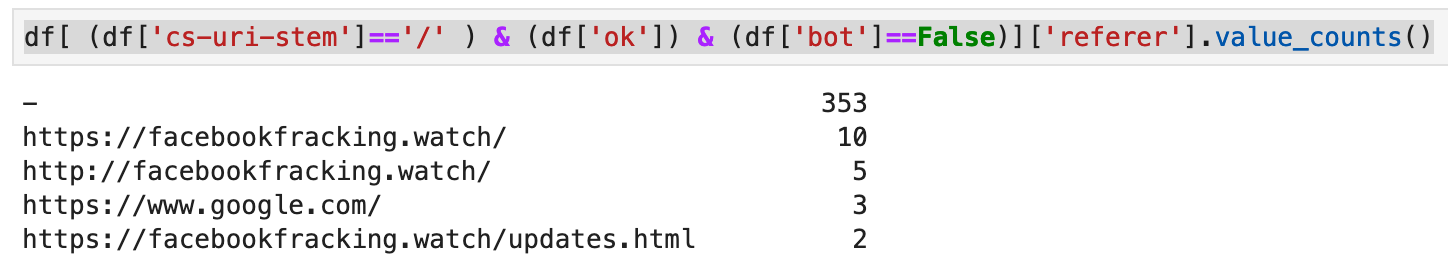
You’ll notice that when combining selector criteria, it’s best to separate them all with parenthesis.
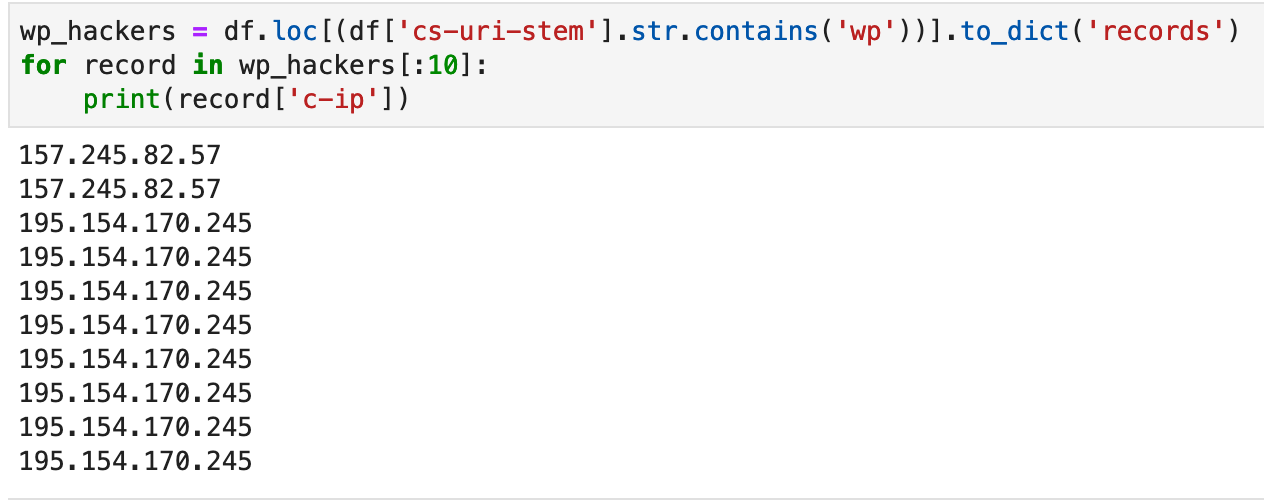
We can do the same sort of select combined with traditional python iteration to pull out details of folks probing for wordpress:
Datatable browsing
One off analysis queries are fun, but sometimes you just need to browse the dataset in it’s entirety. For that, lets install and use the datatable from Plotly’s dash project along with jupyer lab. (note no windows support just yet)
From your python jupyter environment (see how to setup here ) install some specific libraries
pipenv install jupyterlab==1.0 jupyterlab-dash==0.1.0a3
jupyter labextension install jupyterlab-dash@0.1.0-alpha.3
And instead of running jupyter notebook, run:
jupyter lab
I’ve found the best experience at the moment is to use the versions listed above to avoid some gotchas between various apis.
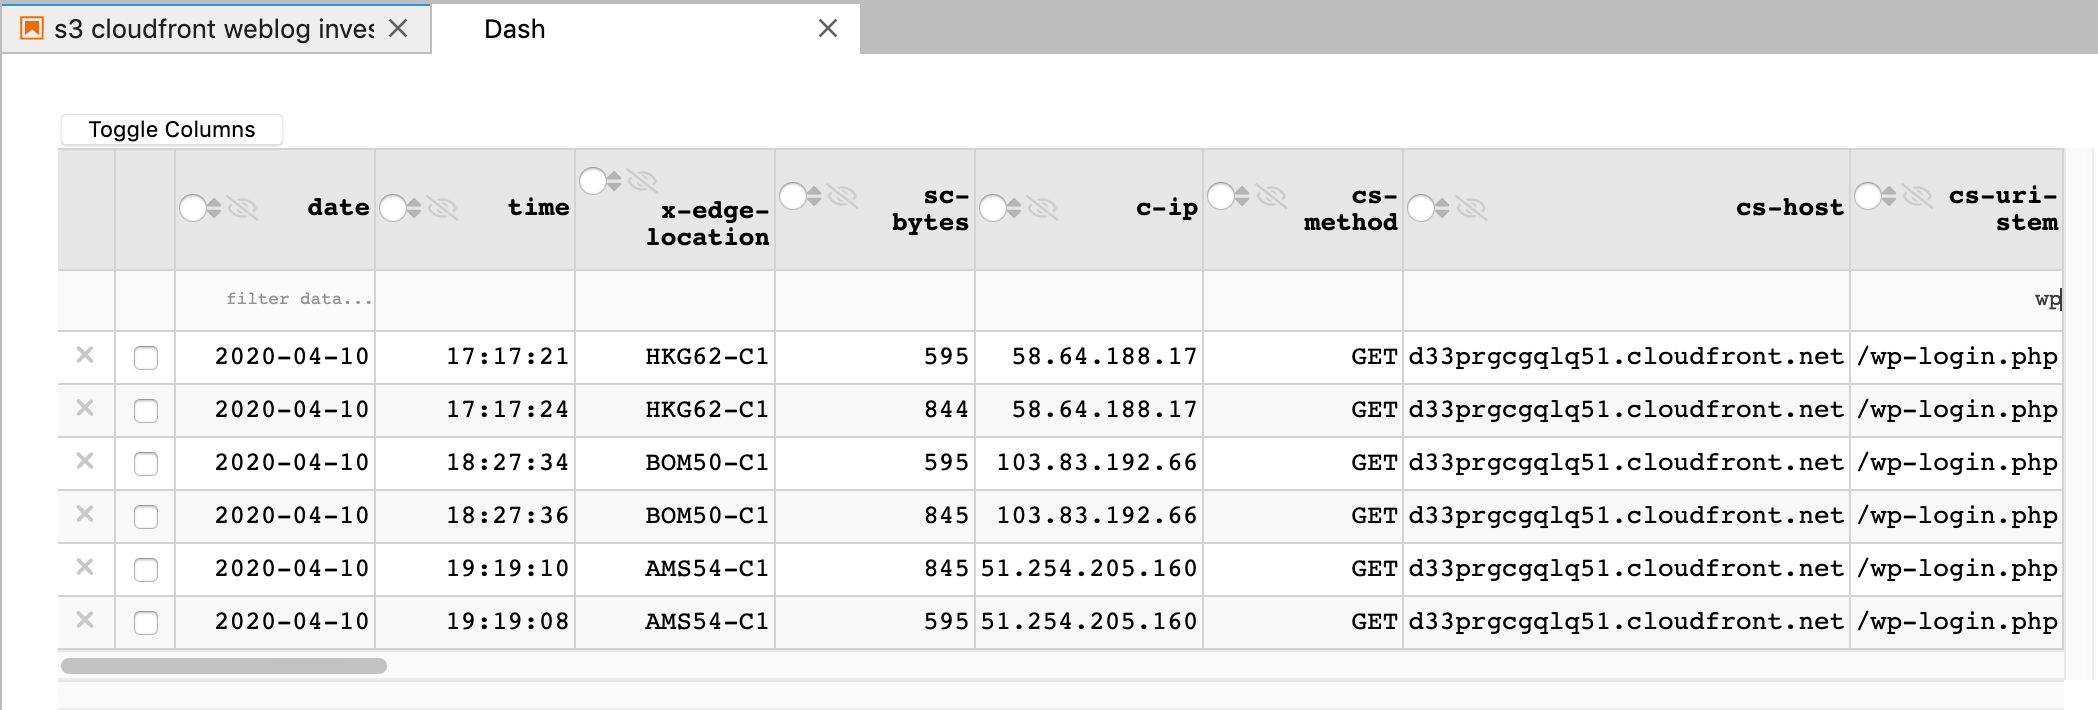
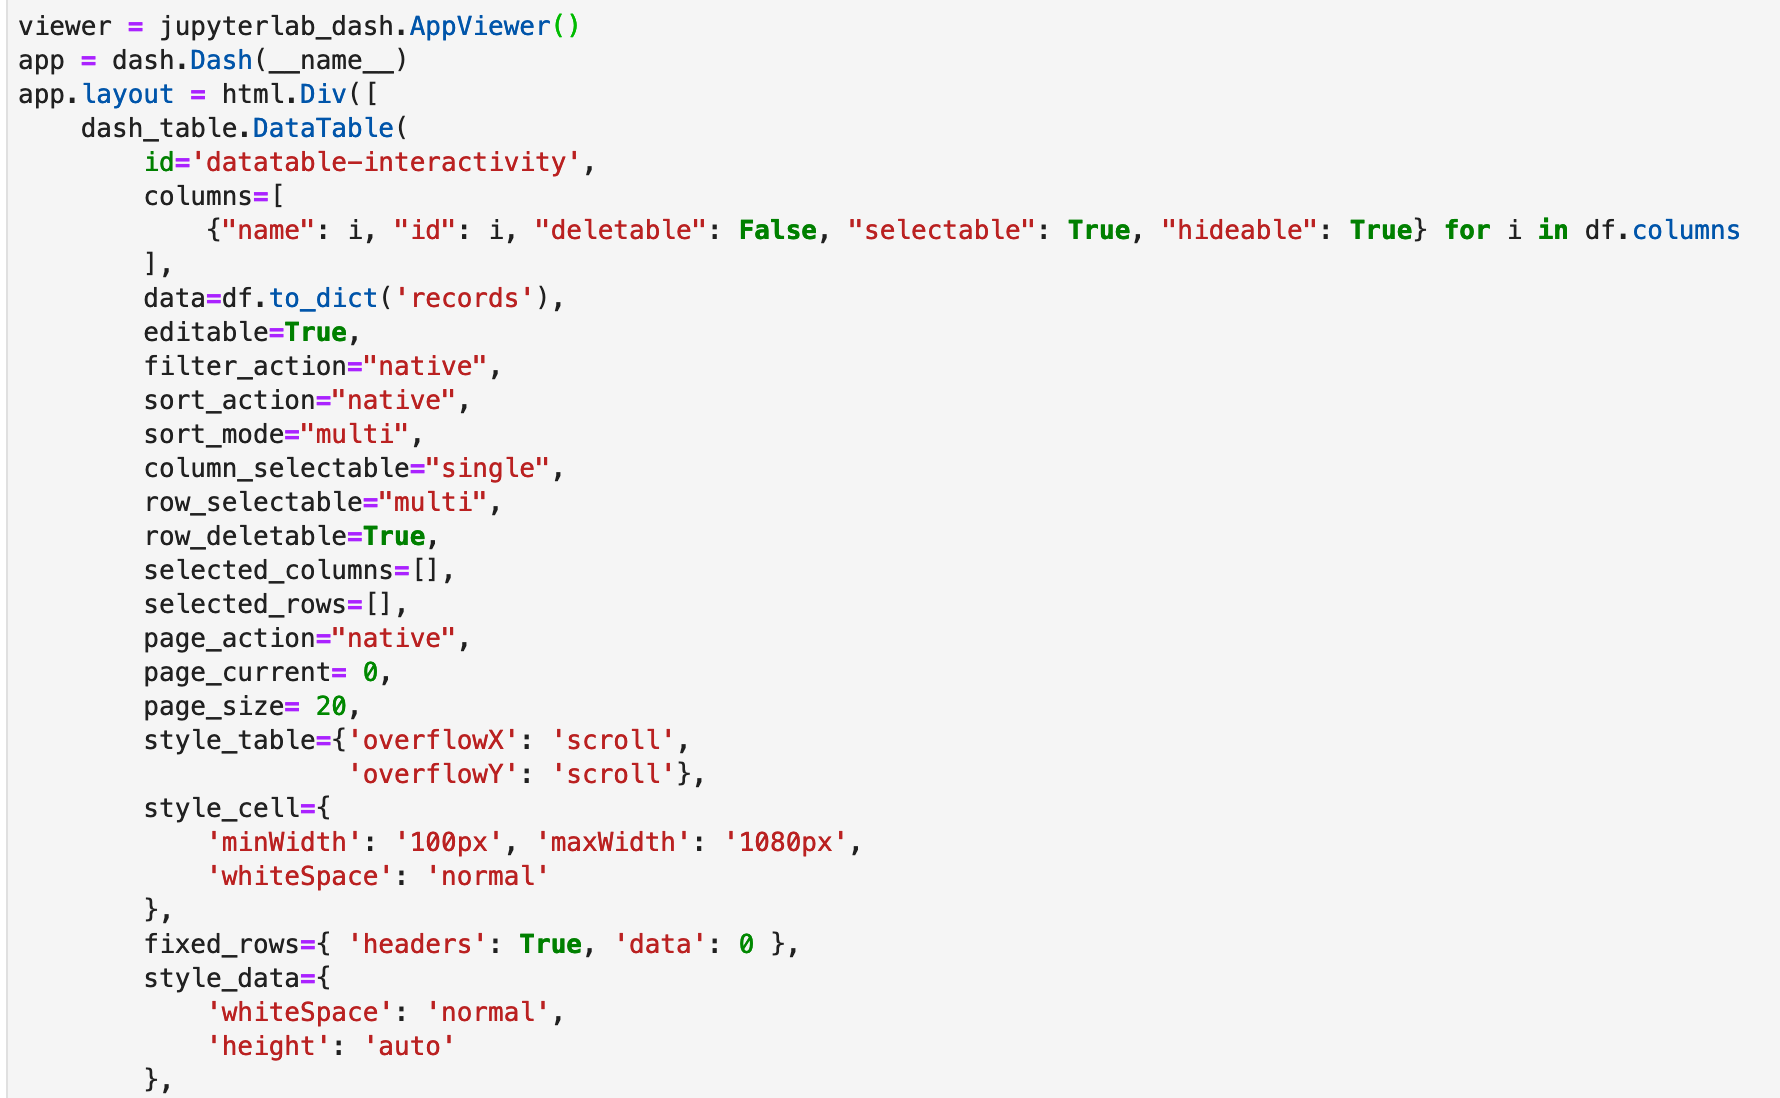
The Dash datatable is a full featured, dataframe browser that allows you to filter, sort, search and trim down your dataframe to hone in on the bits you are interested in. I’ve used it with hundreds of thousands of records so don’t be afraid to load it up. It has ALOT of options, I’ve included the ones I’ve found so far to be the most useable:
When you load it up with your pandas dataframe, you get a separate window that you can use to filter data, hide columns, sort, etc. Here’s a filter for anything with ‘wp’ in the cs-uri-stem column. You can easily combine these to really narrow in;
May You Prosper!
I hope this helps you get a kickstart with pandas for analysis and an easy way to browse a dataset. Hopefully this helps you in your next investigation!
References:
tags: infosec - investigations - incident response - jupyter - pandas